Case Study
Delta Life Science’ world-class noise performance
In label-free biosensing, noise performance is critical. A low baseline noise level is a prerequisite to detecting analytes in very low concentrations and/or to detect low-molecular-weight analytes. Unfortunately, the noise performance of label-free biosensor instruments varies significantly between manufacturers. It can be anything between 0.01 Response units (RU) for the top-end instruments to several RU for lower-end instruments. In this case study, we have investigated the noise performance of Delta Life Science’ prototype instrument to assess how this compares to commercially available instruments.
Approach
Delta Life Science offers several types of chips that differentiate in the number of on-chip sensors and sensor type used. Generally speaking, ring resonator sensors have a slightly lower sensitivity, but their relatively small size allows a higher degree of multiplexing. Contrary, Mach-Zehnder interferometers can achieve a higher sensitivity but are also larger, limiting the multiplexablility. For this test, we used a chip that carries fourteen 3×3 Mach-Zehnder interferometers, allowing sensitive 14-plex detection. In addition, we used Delta Life Science’ proprietary signal processing to process the raw interferometer signals and evaluate the baseline noise. This signal processing was developed at Delta Life Science with the specific aim to optimise noise performance.
In regular operation, binding the biomolecules to the biosensor surface causes a change in the optical refractive index at the immediate chip surface, which is subsequently detected. The detected refractive index change is proportional to the amount of surface-bound biomolecules. However, to exclude any noise contributions originating from biological processes, here we investigated baseline noise in an experiment where the sensor responds to a transition between two fluids having a slightly different refractive index.

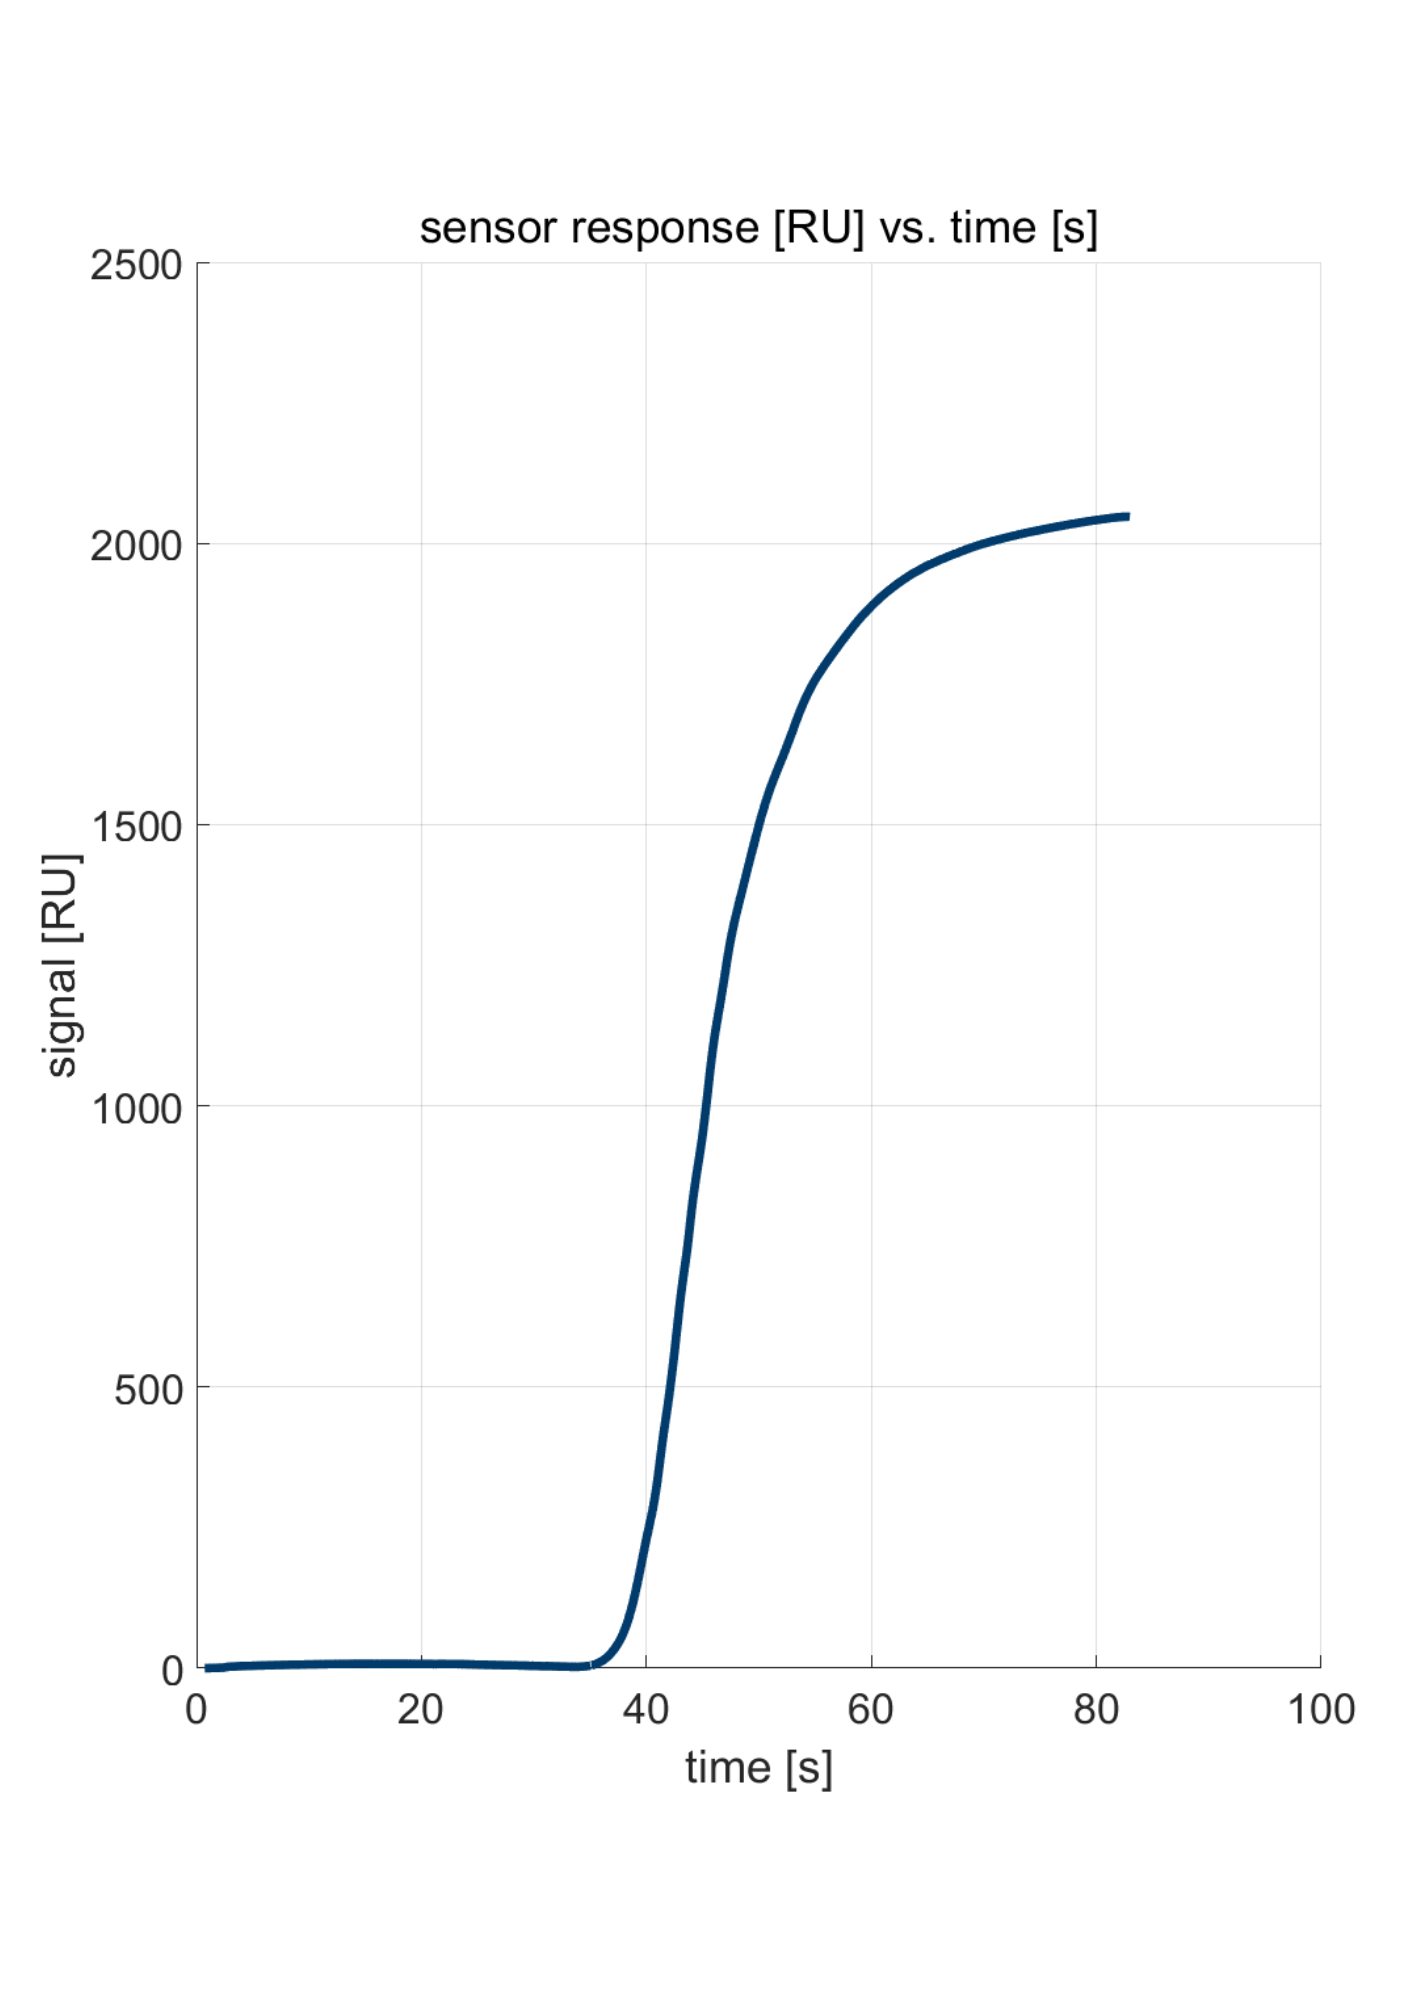
Figure 1: Response for a transition from water to water with 3% IPA.

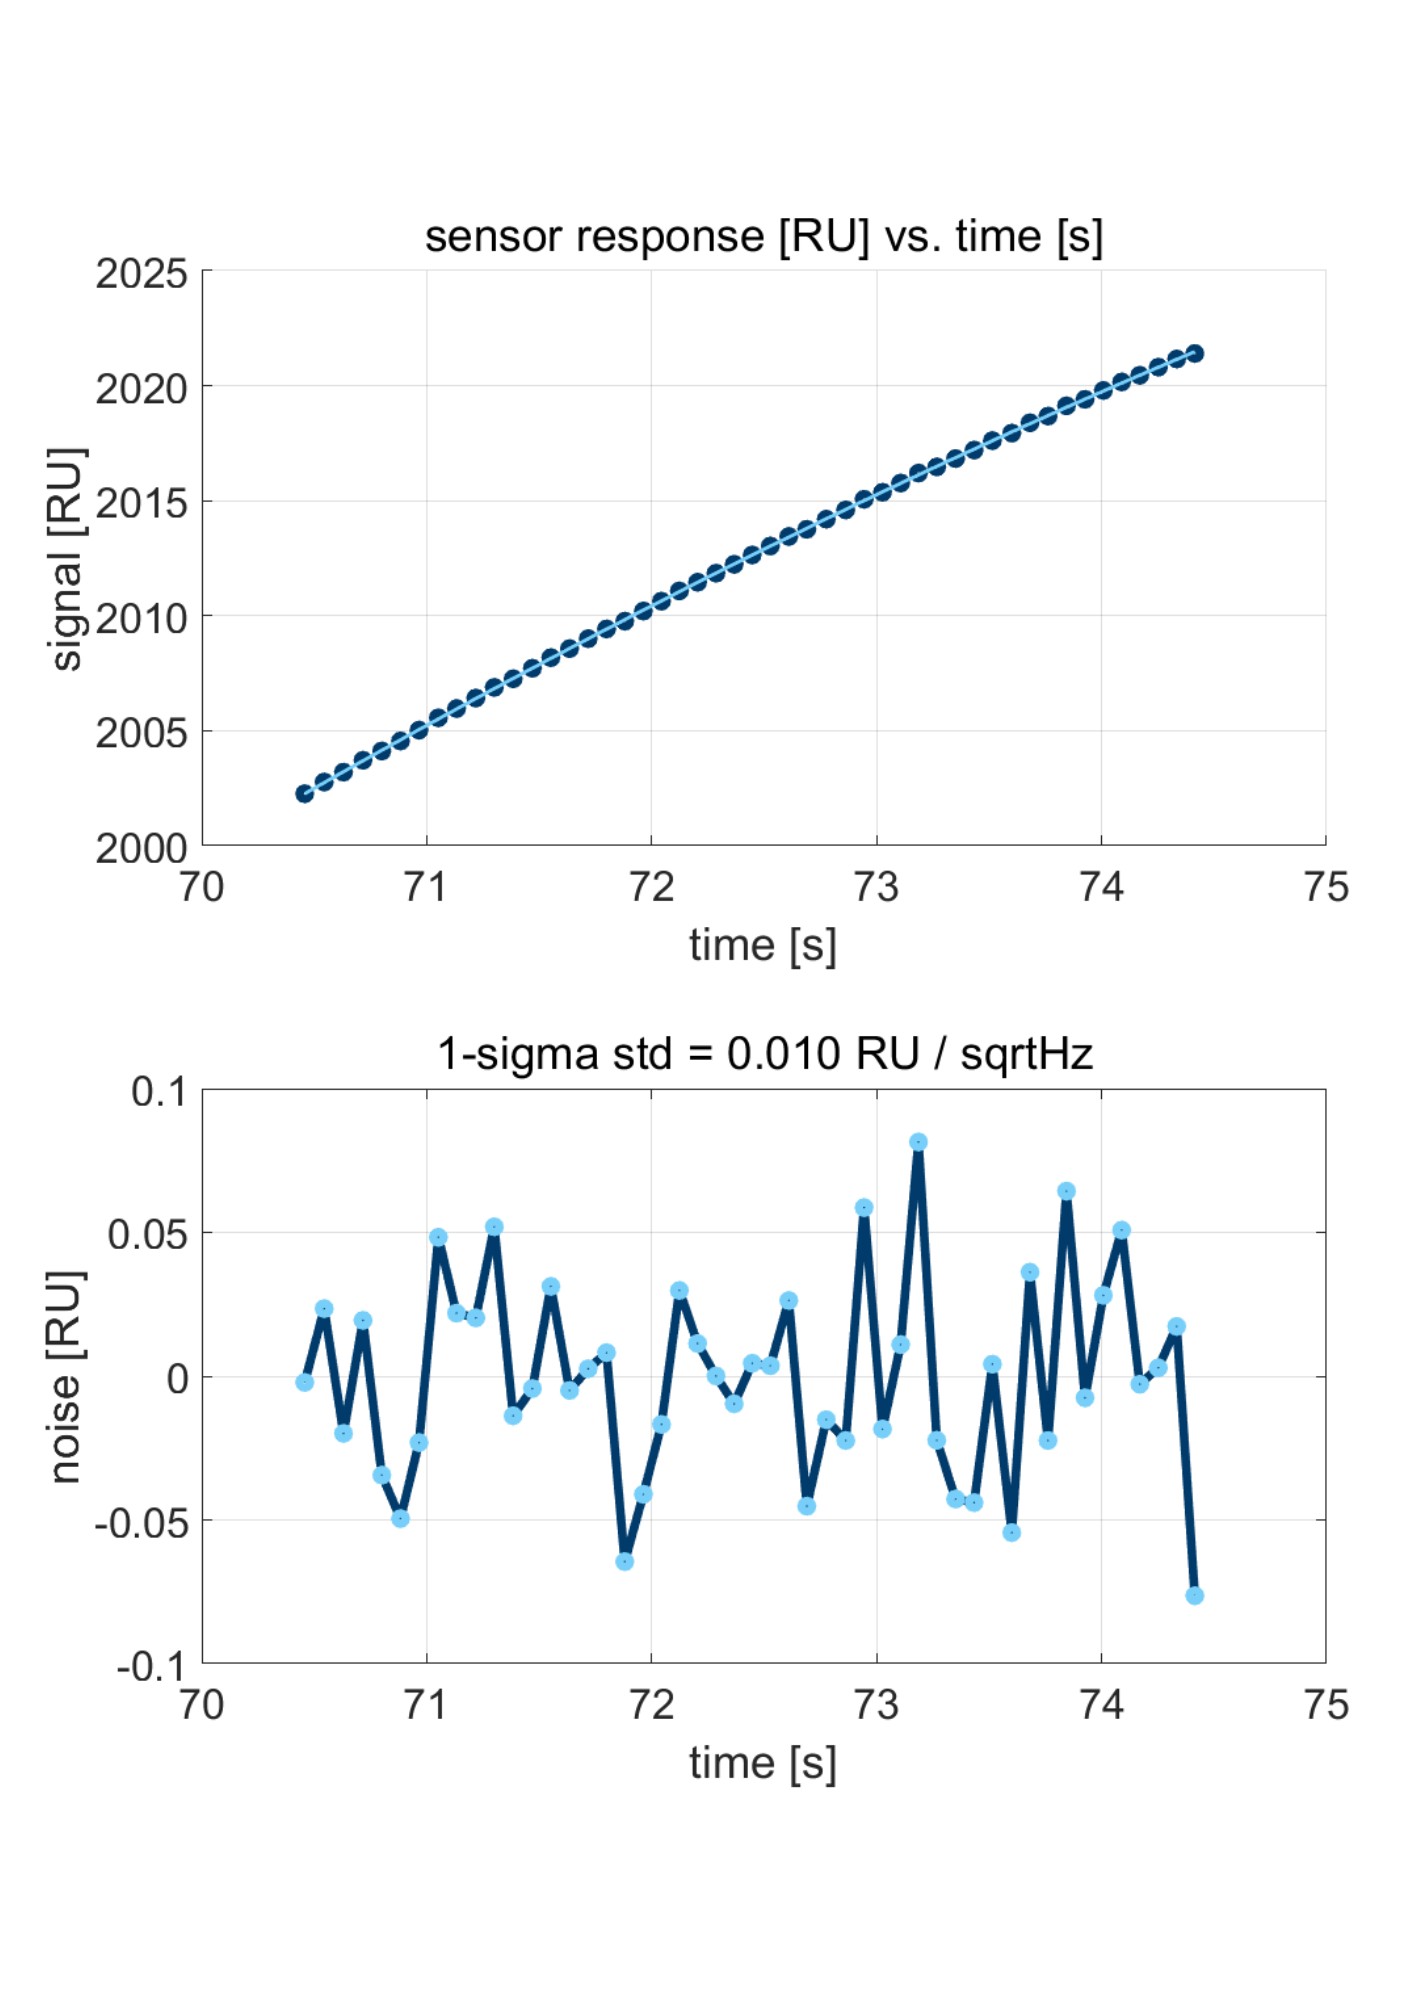
Figure 2: zoom-in on the curve in Figure 1 (top), and the deviation from a 2nd order polynomial fit (bottom).
Results
Figure 1 shows the response of a Delta Life Science’ sensor when transitioning from water to water with 3% isopropanol. A shift of over 2000 RU is observed. Subsequently, the noise was evaluated by zooming in on a particular part of the sensor response. The top graph in Figure 2 shows a zoom-in on the curve in Figure 1, with a 2nd-order polynomial fit. As can be seen, the number of data points amounts to ten per second. In other words, the sensor read-out is at 10Hz. Delta Life Science instrument allows read-out at 1 or 10Hz. The deviation from the fit is shown in the lower graph in Figure 2. The standard deviation from the fit is 0.01 RU per Square Root Hertz.
Conclusion
For 1Hz read-out, we achieve a baseline noise of 0.01 RU. This performance is only met by a select few top-end label-free biosensing instruments. Delta Life Science expects that further optimisation of its biosensors will lead to a further reduction in baseline noise and expect to report on a further reduction in baseline noise by at least a factor 2 in the near future.
